Segreg Example One Breakpoint
[1]:
from matplotlib import pyplot as plt
import matplotlib
import numpy as np

from segreg import analysis
from segreg import data
from segreg.model import OneBkptSegRegEstimator
[2]:
matplotlib.rcParams['legend.numpoints'] = 1
matplotlib.rcParams['figure.figsize'] = (10,5)
matplotlib.rcParams['axes.grid'] = True
np.set_printoptions(precision=3, suppress=True)
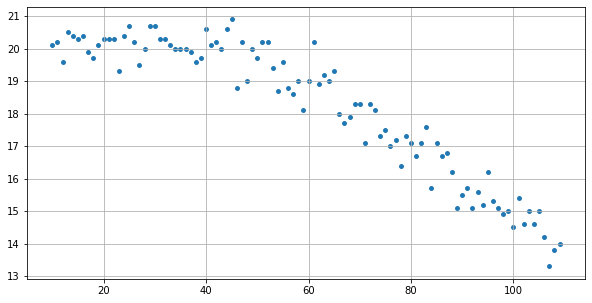
Get a Dataset
[3]:
indep, dep = data.test2()
plt.scatter(indep, dep, s=15);
Estimate a One-Bkpt Fit
[4]:
estimator = OneBkptSegRegEstimator()
estimator.fit(indep, dep)
[4]:
array([50.384, 19.936, -0.007, -0.102, 0.479])
[5]:
estimator.params
[5]:
array([50.384, 19.936, -0.007, -0.102, 0.479])
[6]:
estimator.param_names
[6]:
['u', 'v', 'm1', 'm2', 'sigma']
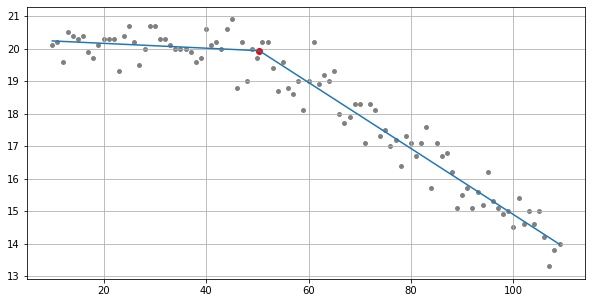
Plot the One-Bkpt Fit
[7]:
func = estimator.model_function
func_arr = [func]
u = estimator.params[0]
extra_pts_arr = [[u]]

analysis.plot_models(func_arr=func_arr,
                     indep=indep,
                     dep=dep,
                     extra_pts_arr=extra_pts_arr,
                     mark_extra_pts=True,
                     scatter_size=15,
                     scatter_color="gray",
                     marker="o");